
SpaceX Goes Public: A Systems Engineering Perspective on One of the Most Anticipated IPOs in Modern History
July 28, 2026
When SpaceX entered the public markets, it immediately became one of the most closely watched technology companies in the world.
The IPO represented far more than another aerospace listing. It brought together multiple narratives that had been developing for years:
reusable launch systems
Starship development
Starlink’s expanding commercial footprint
government and commercial launch services
rapidly growing revenue expectations
enormous investor demand
unprecedented valuation questions
Within only a few weeks of becoming publicly traded, the market had already experienced a remarkable sequence of events.
The initial excitement surrounding the IPO was followed by questions regarding valuation, institutional accumulation, lock-up expirations, short positioning, launch activity, and future earnings expectations. Each new headline appeared to move the market in a different direction.
For investors attempting to understand these developments, one question became increasingly apparent:
How do all of these events interact simultaneously?
Traditional financial analysis usually examines one variable at a time.
Technical analysts focus on price.
Fundamental analysts focus on revenue.
News analysts focus on headlines.
Institutional investors study ownership.
Each perspective provides useful information, yet none naturally explains how these factors continuously influence one another.
That observation motivated the work presented in the accompanying technical paper that includes the full graphical analysis..
Download the paper here: SpaceX Post-IPO Market-State Analysis
Looking Beyond Conventional Market Analysis
Engineering disciplines routinely analyze complex systems by decomposing them into interacting subsystems.
A radar consists of antennas, RF electronics, digital processing, software, thermal behavior, and electromagnetic propagation.
Aircraft performance depends on propulsion, aerodynamics, structures, controls, manufacturing, and operational environments.
Markets exhibit a similar characteristic.
Rather than behaving as isolated collections of prices and news events, they evolve as interacting systems whose components continuously exchange information.
This viewpoint formed the basis for the analytical framework developed at Maxdi.
Instead of asking,
“Where is the stock going?”
we instead ask,
“Which interacting domains are currently governing the market state?”
Reconstructing the SpaceX Narrative
The weeks following the IPO provided an unusually rich sequence of interacting events.
Among the most influential were:
the IPO itself
early speculative enthusiasm
institutional accumulation
analyst commentary
discussions surrounding insider lock-up expirations
increasing short interest
Starship Flight 13
evolving commercial expectations for Starlink
broader technology-sector sentiment
Individually, each event can be understood.
Collectively, however, they create a much more complicated dynamic.
The challenge is no longer simply tracking events.
The challenge becomes understanding how one event changes the significance of another.
A Graph-Native View of Market Behavior
The accompanying paper introduces a graph-native representation of these interactions.
Rather than displaying dozens of disconnected indicators, the market is represented as an interconnected system of domains linked through directional influences.
This allows operational events, valuation effects, institutional behavior, ownership structure, and external market conditions to be visualized simultaneously.
The objective is not simply to display more information.
The objective is to reveal relationships that would otherwise remain hidden.
Figure 1 — The Market-System Plate
The first figure summarizes the entire post-IPO market state.
Instead of treating price as the primary object, price becomes only one observable outcome of a larger interacting system.
Positive operational developments appear alongside valuation pressures, ownership dynamics, institutional demand, and market sentiment.
The resulting visualization acts as a system-level dashboard rather than a conventional stock chart.
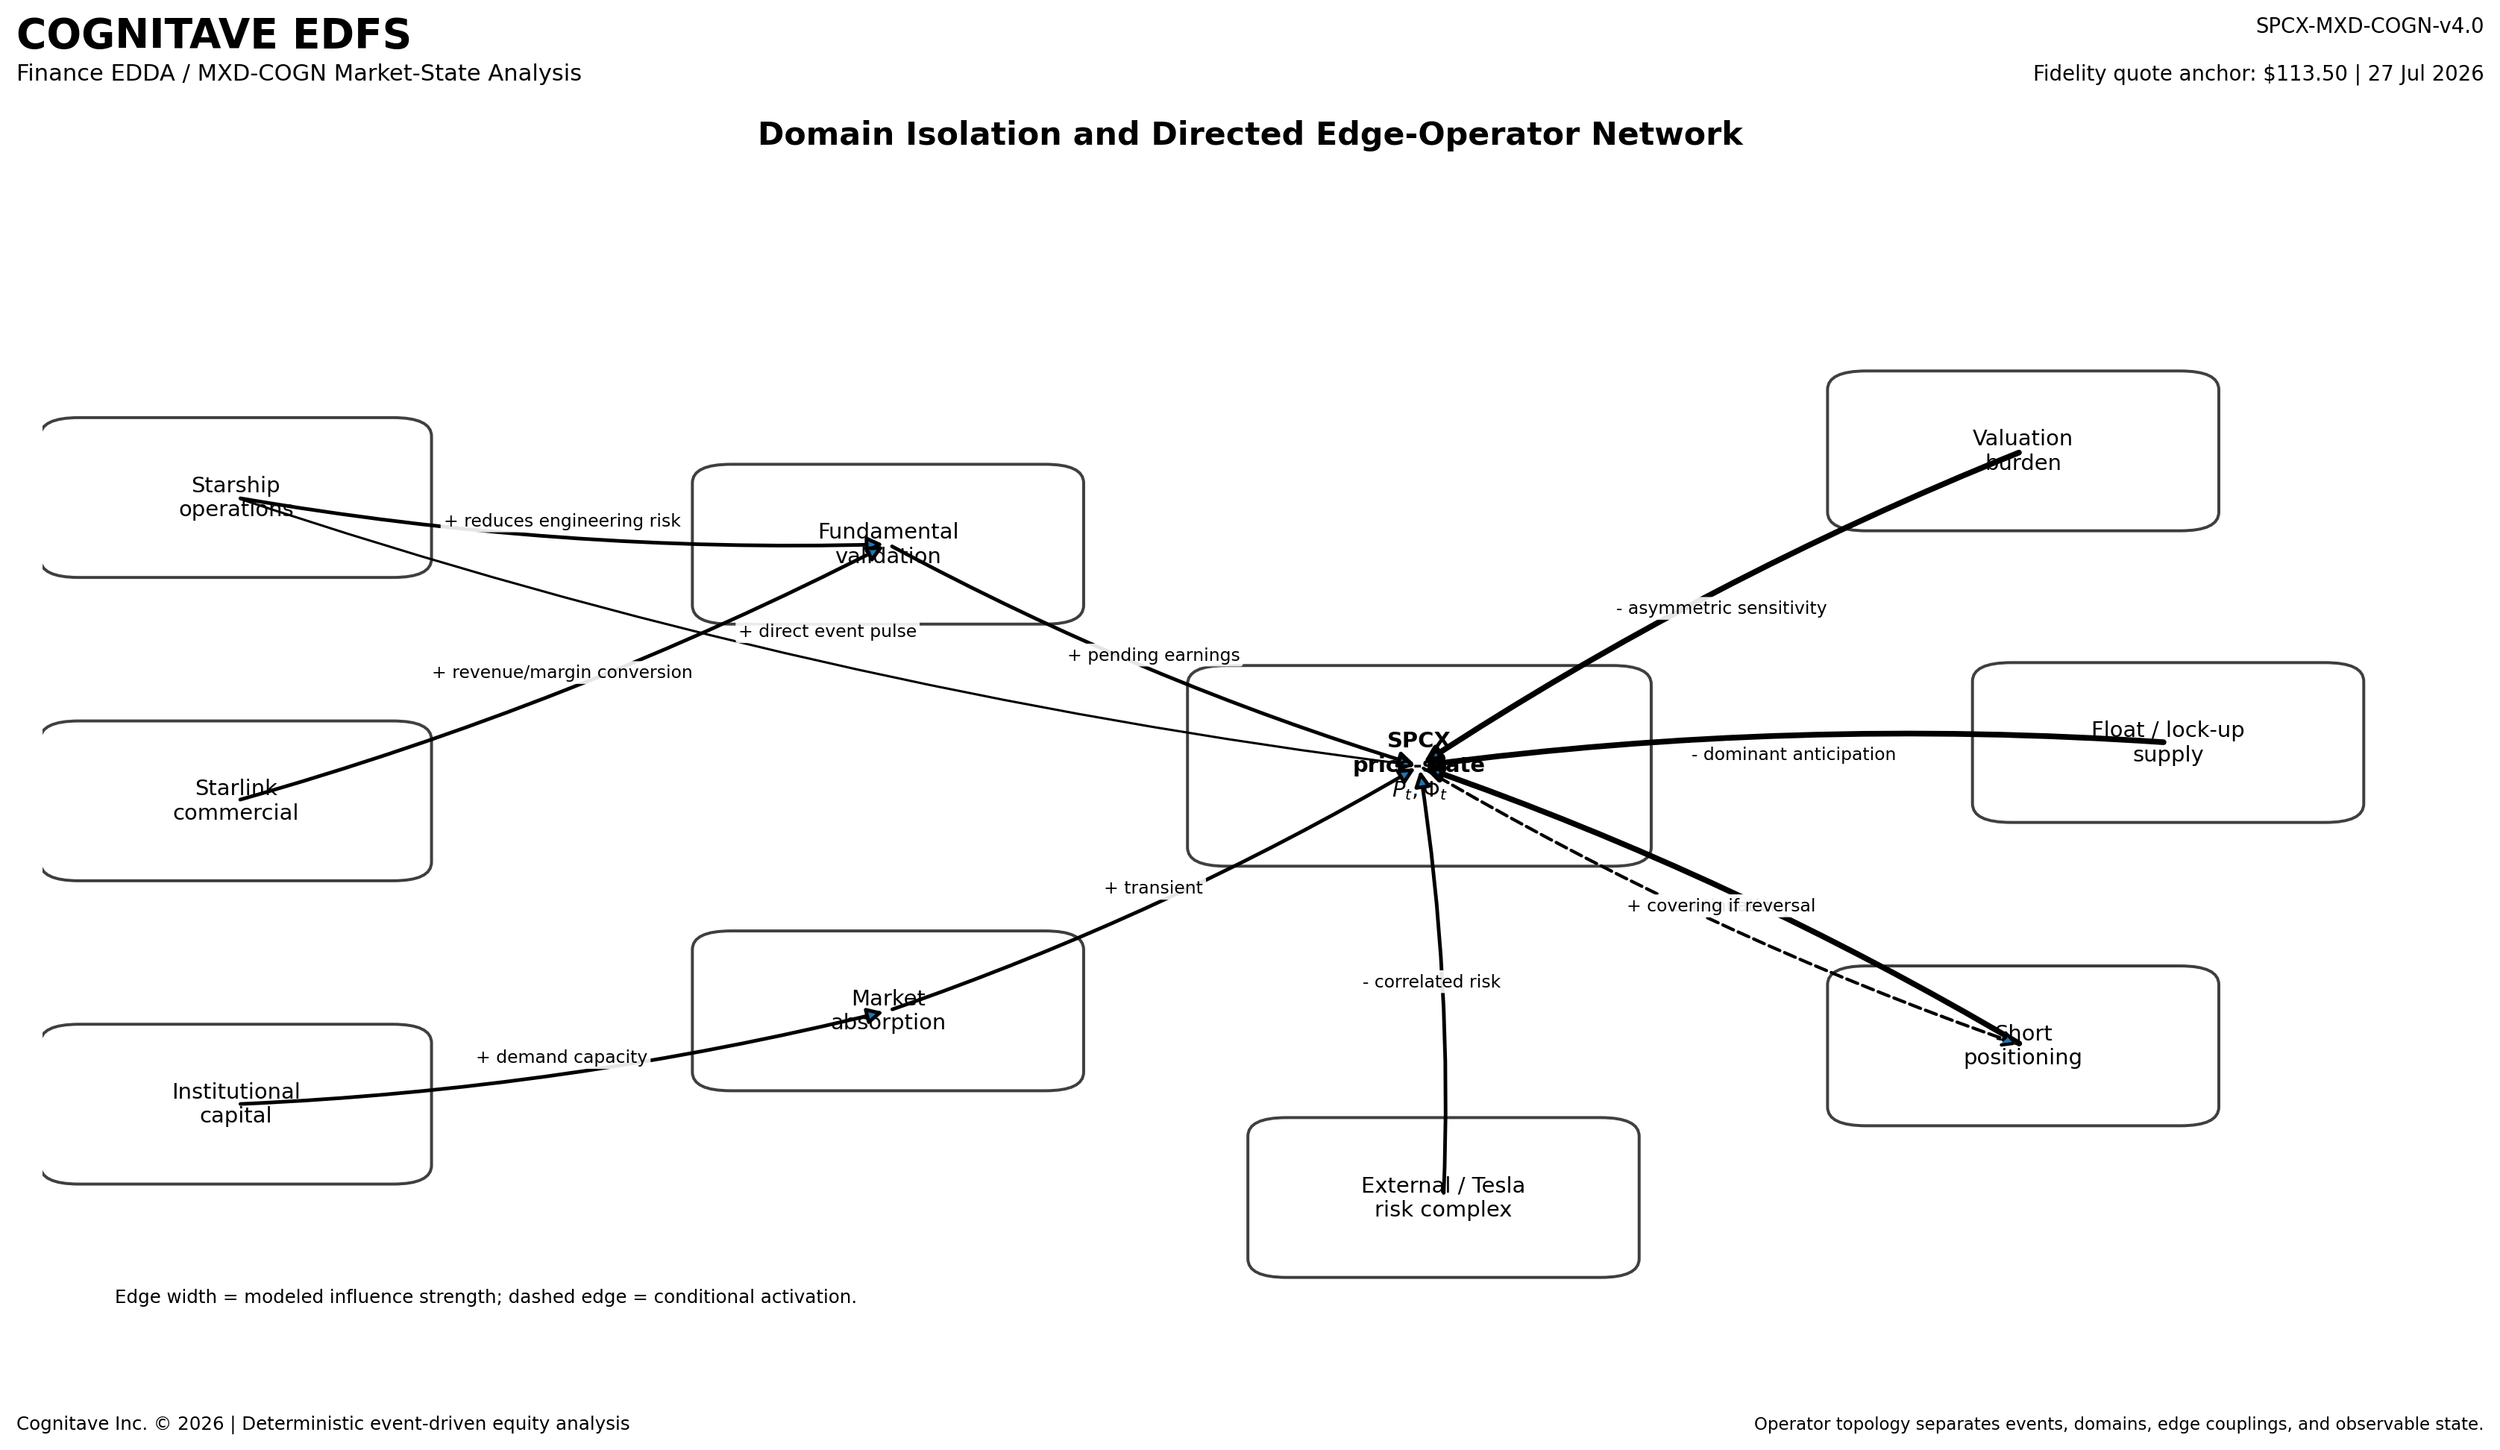
Figure 2 — Domain Interaction Network
The second figure illustrates how individual domains influence one another.
Operational success strengthens commercial confidence.
Commercial performance affects valuation.
Ownership changes alter supply.
Institutional demand modifies market absorption.
External events influence all of these simultaneously.
The emphasis shifts from isolated variables toward interaction pathways.
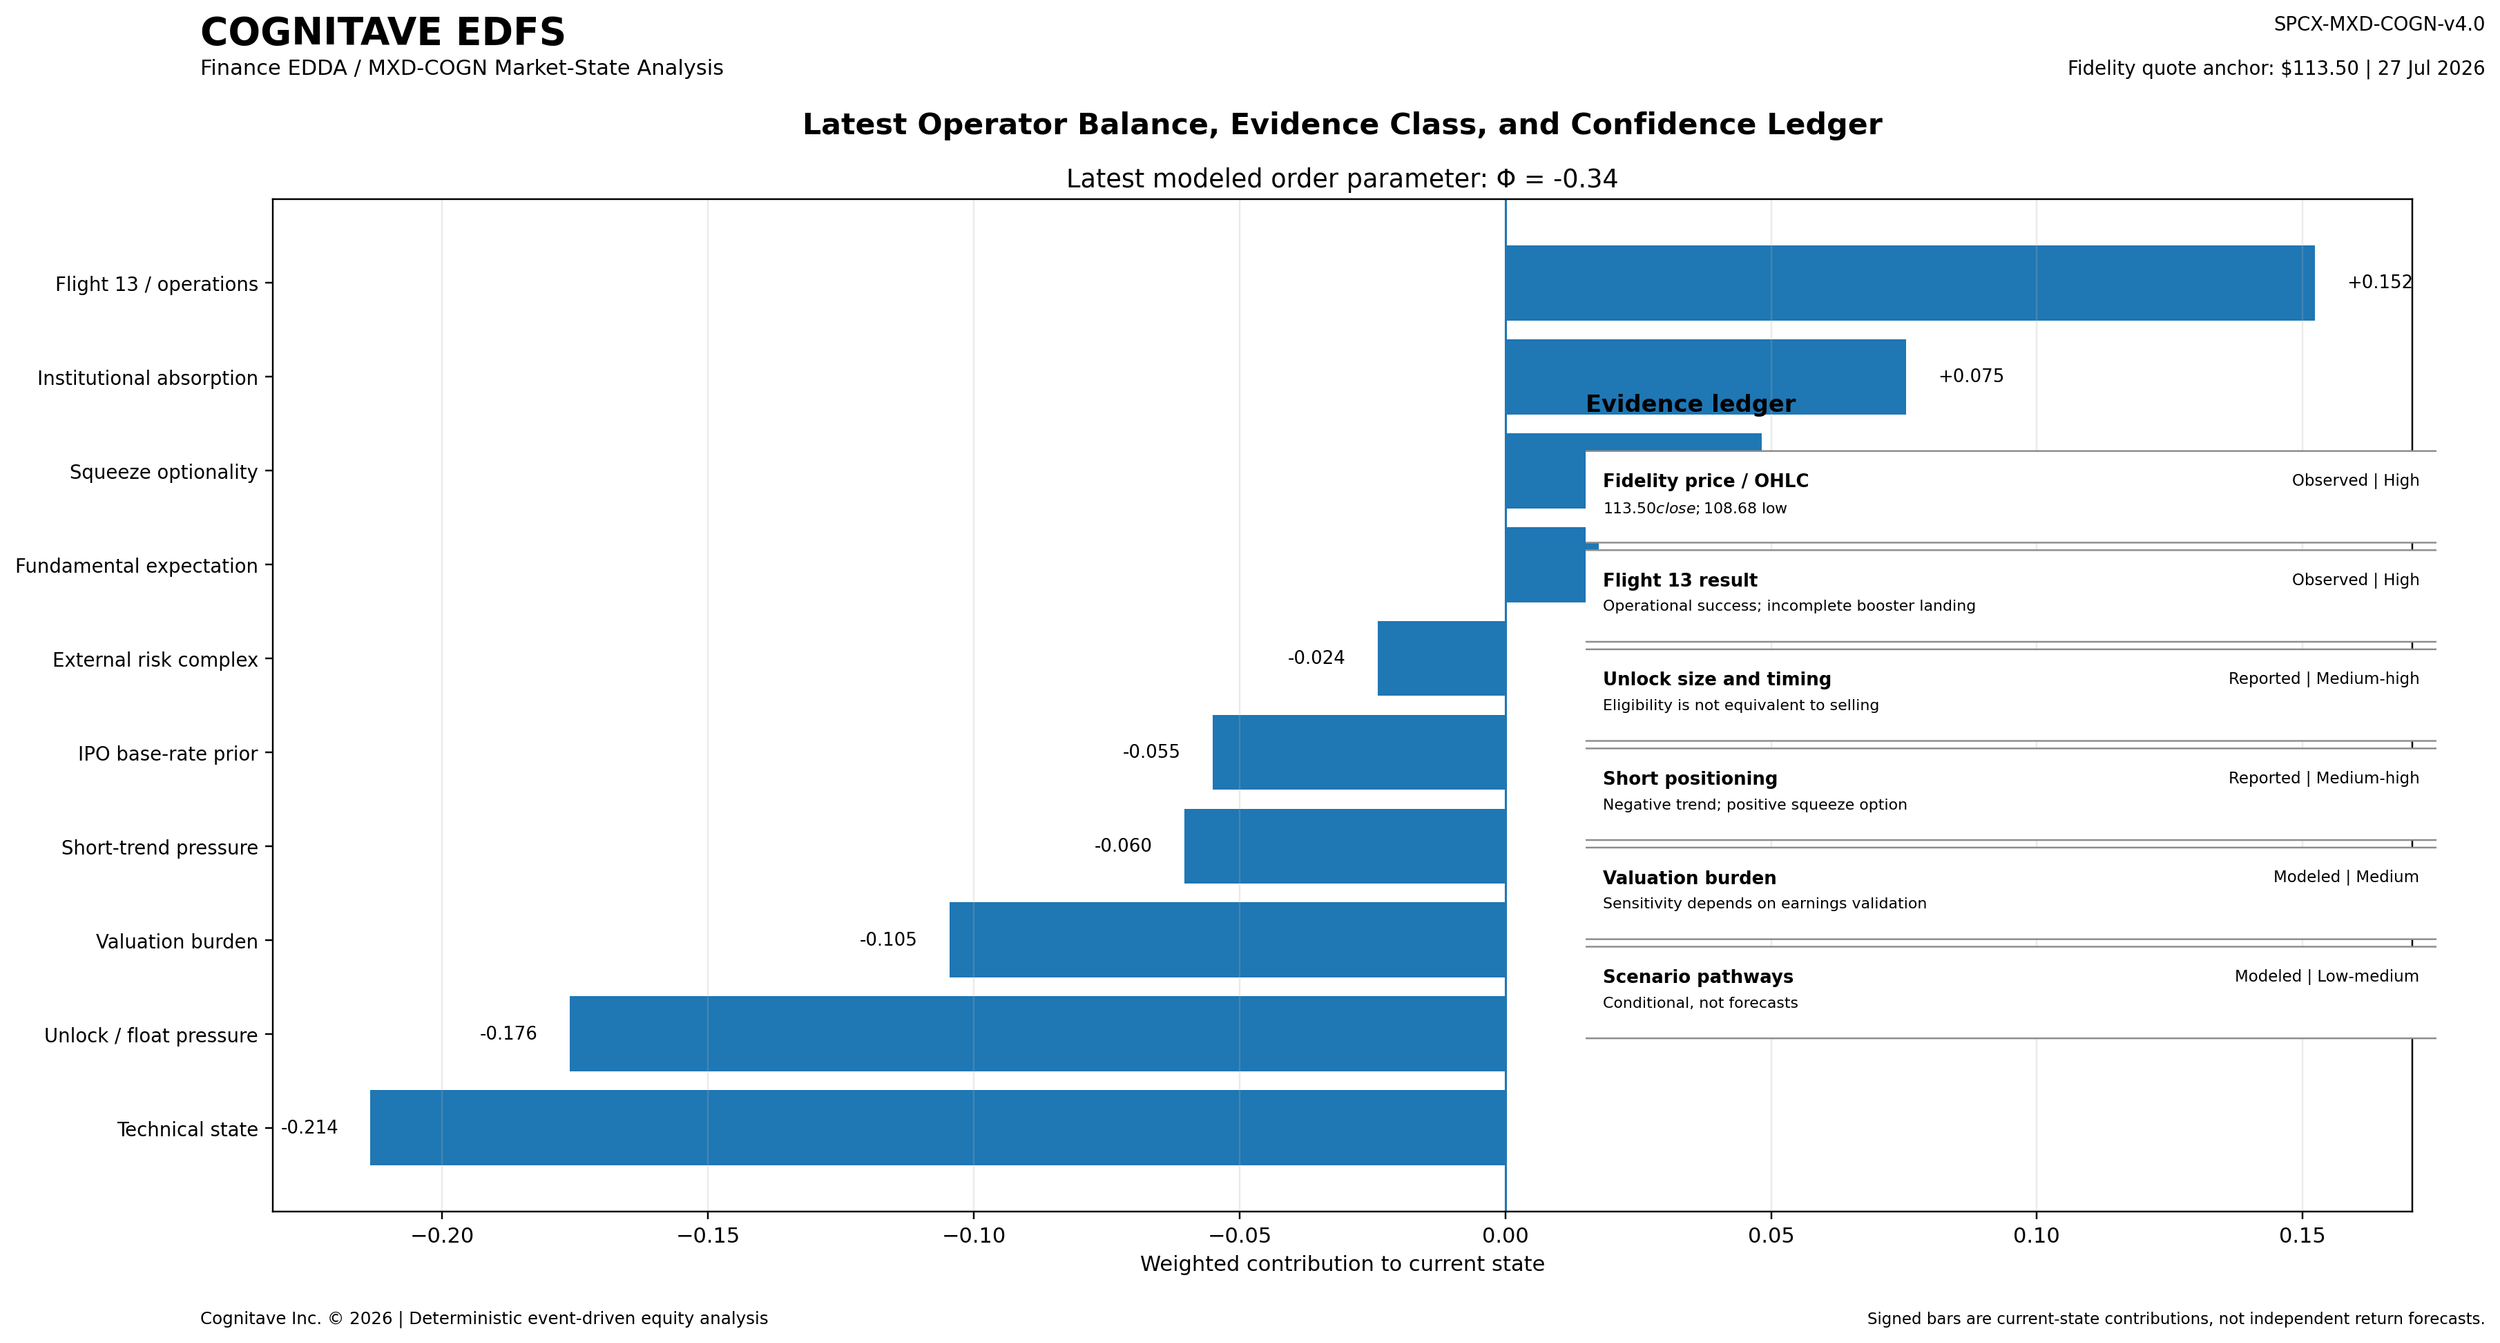
Figure 3 — Operator Balance
Financial markets rarely move because of a single reason.
The operator balance graph ranks the relative influence of competing positive and negative forces acting on the stock at a given point in time.
Rather than asking which headline matters most, the framework estimates which collection of factors currently dominates the market state.
Figure 4 — Conditional Market Evolution
Markets cannot be predicted with certainty.
Instead of producing deterministic forecasts, the framework evaluates several conditional future pathways.
Different combinations of operational execution, valuation compression, institutional demand, earnings performance, and ownership changes produce different market trajectories.
The emphasis is on understanding what would need to happen rather than predicting what will happen.
Figure 5 — Supporting Technical Evidence
The final figure provides the supporting technical measurements that underlie the higher-level graphical interpretation.
These include price behavior, volume evolution, stability indicators, and state variables that provide additional confidence for the broader systems-level interpretation.
From Electronics Design to Financial Systems
Readers familiar with Maxdi may recognize a common philosophy.
The same systems engineering principles originally developed for complex engineering workflows have now been extended into financial analysis.
This implementation is known internally as Finance EDFS—the finance edition of Electronics Design Flow Studio (EDFS).
Rather than replacing traditional market analysis, Finance EDFS augments it by introducing graph-native representations inspired by systems engineering, network theory, and engineering design automation.
The accompanying technical paper provides a first look at this evolving research direction.
Looking Ahead
SpaceX represents only the beginning.
The same methodology can be applied to semiconductor companies, artificial intelligence infrastructure, satellite communications, energy markets, automotive technology, and other domains where numerous interacting factors determine system behavior.
As these studies continue, we expect the framework to evolve into a broader platform for graph-native analysis of complex technical and economic systems.
Interested in Finance EDFS?
This SpaceX study is one example of the analytical capabilities currently being developed within Finance EDFS, the financial analysis edition of Electronics Design Flow Studio, created by Maxdi.
If your organization is interested in advanced graph-native market analysis, operator-based modeling, or collaborative research, we welcome the opportunity to connect.
Contact:
Research chronology note — August 2026: This article represents an early Finance EDDA / Finance EDFS application using event-driven state evolution. Subsequent research has extended the formulation toward graph-operator inference flow, memory, hybrid event dynamics, and external inference fibers. The original analysis is retained here as part of the research record.
IMAGE CAPTION: Connected state, evolving observation. Antony Gormley’s Chord (2015), installed through the stairwell of MIT’s Simons Building, is formed from interconnected polyhedral cells whose local elements participate in a larger structural whole. Its network of nodes, edges, changing geometry, and vertical traversal provides a useful visual analogue for the problem considered here: how a financial state evolves as events propagate through interacting domains rather than acting on isolated variables. MIT describes Chord as 33 stainless-steel polyhedra joined into a vertical helical chain, built from 905 elements and 541 nodes. It hangs through four stories at the intersection of Mathematics and Chemistry. MIT Chord emphasizes that the structure is conceived as a connected totality in which a disturbance to one part affects the whole. In Finance EDDA formulation: the object of interest is not an isolated variable but the evolution of a connected state under events transmitted through a network.